Davis Law Group Receives Seattle Business Magazine’s ‘Best Companies to Work For’ Award Learn More
Davis Law Group Receives Seattle Business Magazine’s ‘Best Companies to Work For’ Award Learn More
 It’s no secret that football fans love to have a few drinks. But when those same fans get behind the wheel, what kind of damage are they doing? At Davis Law Group Car Accident and Personal Injury Lawyers we represent victims of drunk driving accidents. We try to encourage responsible behavior and prevent drunk driving tragedies. Despite the efforts of educators, law enforcement, and countless non-profits, the problem of drunk driving persists, and some colleges are especially prone its devastating consequences. To illustrate this issue, we focused on the teams in the Sporting News’ preseason Top 25 poll, a collection of schools scattered across the country. We then compared each team’s drunk driving fatality rate in its geographic footprint.
The study has been featured on 247Sports, Penn Live, UGAWire, and Nola.com.
The University of South Carolina, located in Columbia, SC, had the highest rate in our study. Each year, there are an average of 7.45 fatalities as a result of alcohol-impaired driving per 100,000 people in the Gamecocks’ region. Drivers heading to Williams-Brice Stadium this season…watch out. Michigan came last — but that’s a good thing. In Washtenaw County and the surrounding area, there are just 0.73 drunk driving deaths per 100,000 people. Teams located near or in big cities — Michigan (25), Washington (22), USC (21) and Stanford (20) — all ranked low on our list, while teams south of the Mason-Dixon line generally had a higher rate of fatal car crashes. Click image to see a high-res version 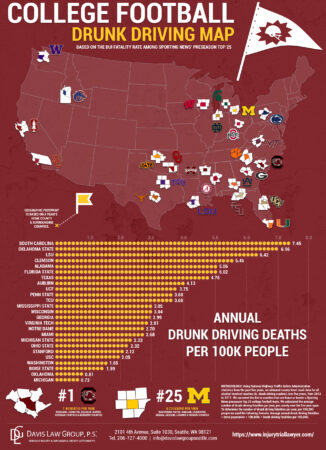 Click image to see a high-res version
If you’ve been injured in Seattle, WA, and need legal assistance, contact Davis Law Group Car Accident and Personal Injury Lawyers. Contact our legal team and schedule a free consultation with a car accident lawyer today. We proudly serve King County in Washington and it’s surrounding areas. Visit our law office at:
Davis Law Group Car Accident and Personal Injury Lawyers 2101 4th Ave 1030 Seattle, WA 98121 (206) 727 4000 Hours: Open 24/7
Office Hours:
24 hours/day. 7 days/week.
Phone:
Contact Us
Complete this CONFIDENTIAL form or call 206-727-4000 for a FREE consultation.